Pages

Thursday, March 29, 2012

$VIX - Volatile April Ahead

The VIX has started to heat up, and a large bullish wedge is in place.  It stopped shy of the 50 day moving average yesterday, hit the trendline, and likely will take a few days to consolidate before gapping over it.  I suspect, next week, there will likely be a "one day wonder" down for the VIX before it spikes again over the trendline. 

Several target zones have been outlined for the month of April.  Notice how the VIX spiked up at the alignment indicated by the arrow.  
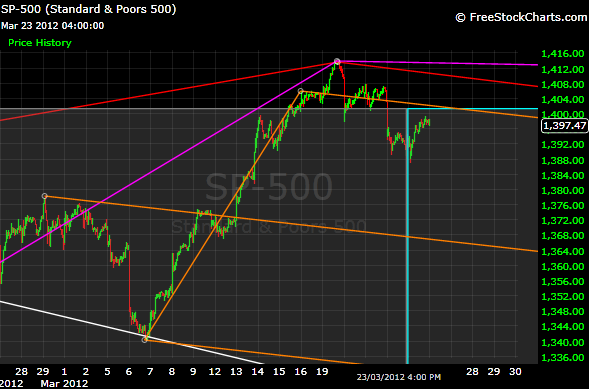
Daily Chart


First and foremost, the low is in place with capitulation a few days ago.  A higher high from yesterday is anticipated during the next few days, then cool off again. 

Several targets are outlined for the month of April as indicated by the green lines.  

Daily Chart

Tuesday, March 27, 2012

Gold - Important Time Approaching

Gold bounced up from the orange fork, and is now finding some resistance.  Gold may be quite volatile in the short run as it consolidates between support and resistance. 

The yellow time cycle comes due on April 10th.  Gold may test the green supports around that time.

Patience is the key as it will be exciting for Gold from that point onwards.  

Daily

Sunday, March 25, 2012

$SPX - Week Ahead

SPX put in lower lows and lower highs last week.  There is resistance at the orange fork line just above, and price may slump from that level.       

The cycle analysis does look quite positive around March 29th though, then negative into early April. 

15min Chart


The VIX found support at the fork line which has been important in marking turns in the past.  As well, a wedge pattern is in place along with large scale divergence going back to October.


Daily Chart

Saturday, March 24, 2012

Silver - Update

Silver found an important support level last week, and bounced.  It could be ready to break, and test above the white trendline. 

However, some limited downside still may be likely.  The red-green support zone would be very attractive ($29.50-80 for the Silver futures).  The red support may be the maximum downside potential for Silver on a near term basis.

Once the low is in, Silver should rocket up to test $38-39 according to the model.  Gold is already showing relative strength compared to Silver by testing near the March 19th high on Friday.  The implication is that the downtrend for Gold/Silver is nearing completion.                   

60min Chart

Wednesday, March 21, 2012

$VIX - Moderate Pop Expected

As mentioned earlier, the cycle analysis is negative into the end of the week for SPX.  VIX can see a moderate pop during this period with a breakout of an inverse Head and Shoulders pattern.

SPX could decline into Friday or Monday.  

10min Chart


Downside on UVXY looks minimal with a decent move higher targeted short term.

30min Chart

Monday, March 19, 2012

SPY - Negative Time Cycle Due

A negative time cycle is due on March 20th.  The cycle analysis is also quite negative on the 20th, somewhat positive on the 21st, and then negative into the end of the week. 

The equal time and price boxes show a measured move is in place.  Interestingly, the time span of the box is the same as the negative time cycle (red).  As well, there are several resistances in terms of geometry.

Daily Chart

Thursday, March 15, 2012

$SPX - Target Reached - Dip Expected Next

The next timing cycle due is March 20th, and the cycle suggests a low.  Both Monday and especially Tuesday, March 20th, look negative in the cycle analysis. 

There are supports around 1372 SPX.  After that, a final spike with a slight higher high is anticipated.

60min Chart


The plan for the week (shown in yellow) was a decent estimate.  March 13th was forecast as a positive day.  The target was reached early though the timing of highs and lows worked well.

The following chart is updated from last Sunday:


15min Chart

This chart shows the maximum possible downside in the near term to test horizontal support.  If it does come down this much that would be around $29.50 for the Silver future.

A higher high at $38.50 for the Silver future is still targeted soon afterwards.

60min Chart


Silver is following the basic pattern from the symmetry outlined on Dec 31st, 2011.  Silver is nearing support with a higher high still expected to follow to point 6.

Chart from analysis December 31st, 2011:  

http://cyclicalmarketanalysis.blogspot.com/2011/12/silvergold-parabolic-move-coming.html

Daily Chart