Pages

Thursday, August 30, 2012

$SPX - Plan for Next Week

SPX is approaching the yellow midfork today.  Short term, price may attempt to bounce off that again soon, but stay below the upper turquoise fork.  Overall, SPX is anticipated to decline into a low due around September 6th.

30min Chart


At the current pace UVXY probably will not reach over $6 until next week.  As a result though, the target has been raised slightly.

30min Chart

Monday, August 27, 2012

UVXY - Spike This Week

Notice that the confluence of fork supports was reached today.  In continuation of the short term plan, UVXY could spike sharply this week to test the area of the upper orange fork resistance. 

This week, the cycle analysis for SPX is quite negative.  September charts will be coming shortly, and an outline of September cycles.  

30min Chart

Thursday, August 23, 2012

$SPX - Short Term Update

The timing cycle outlined previously was not perfect, but reasonably close to signaling a turn at #3.  SPX is trading below the yellow fork resistance now, and the cycle analysis is quite negative next week.  Expect a sudden gap down within this time period. 

60min Chart

Monday, August 20, 2012

UVXY - Gradual Rising Trend Phase

Likely the short term phase of a gradually rising trend has commenced for UVXY.  Support has held well recently, and the price can pop into the end of August.  This is the short term outlook, and will be updated in late August for September levels. 

The bigger picture is much more interesting, but the first phase of the bigger picture is the gradually rising trend in the analysis. 

60min Chart

Thursday, August 16, 2012

$SPX - Equal Time Cycle Due

An equal time cycle is due Friday, August 17th.  SPX finally managed to push just above the turquoise fork, but momentum is weak, and it is still trading around the upper yellow fork. 

30min Chart


UVXY found some resistance at the orange midfork, but there is plenty of support below.   


5min Chart


Tuesday, August 14, 2012

$SPX - Failed Again


SPX tried to advance above the turquoise fork resistance but failed once again.  The cycles are mostly negative during the rest of August.  Additionally, there are very negative spots in mid-September as well.  Initially it may establish a gradual trend lower with a fair amount of chop along the way.      

15min Chart


The negative cycles have been discussed, and the market is providing evidence that suggests weakness ahead.  There is no credible possibility of significant upside ahead in the near term. 

These correlations will not provide precise timing of large declines used on their own, but clearly caution is a requirement going forward from this point.  A minor higher high is still quite possible, but nothing significant.

RLX, Rifin, TRAN, RUT are all leading down from the May high.

Daily Chart


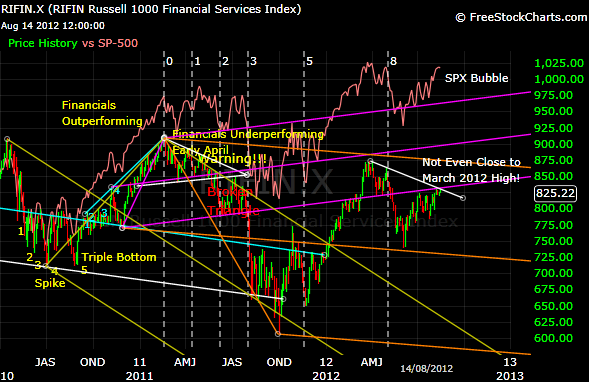
The Financial index Rifin double topped in 2010 and 2011, and has a lower high this year. 

This chart below was shown in 2011 as evidence prior to the summer 2011 collapse.  The warning signs were obvious at that time, in advance, of the plunge.

The warnings are similar this year with financials continuing to underperform dramatically.  The next crisis is more likely to come from the Banking sector than Europe.  One word can justify a huge spike in the VIX - "Lehman".


2day Chart


Initially, the large pattern suggests UVXY establishes a gradually rising trend.  Watch for a trend to develop as shown with the orange fork support and resistance.  It will likely be choppy, but overall gradually rising. 

15min Chart

Wednesday, August 8, 2012

$SPX - Resistance Reached

Price reached the yellow fork resistance.  The cycle analysis does look a little weak today and tomorrow, with another positive spot Friday, Aug 10th perhaps extending to the 13th at the latest.  After some settling now, SPX may attempt another final push late this week.  It may have already topped, or it may manage a slight higher high still. 
However, the cycle analysis turns negative early next week, and continues to weaken into late August.  As well, there are very negative spots in mid-September.  Therefore, a high is due, and then the next low mid-September.  A downtrend for over a month is expected with the decline gradual at first, then accelerating lower.

30min Chart


15min Chart

Sunday, August 5, 2012

UVXY - Bottoming/Gradual Rise Soon

UVXY is in the late stage of the bottoming process.  Once the bottom is in place, then watch for a gradual rise to form as the next phase.  That should be underway this week.  It will start to rise slowly with the gradual rise, but as the yellow fork breaks, then the acceleration phase up begins.

The next significant high for UVXY is due in mid-September.  Starting this week, the SPX cycle analysis turns negative into the same time frame.        

60min Chart


Daily Chart

Wednesday, August 1, 2012

$SPX - Blow-Off Top Potential

There could be potential for a blow-off top in this situation.  SPX is trading within the yellow fork, but if it breaks above then it would quickly spike up. 

Any such breakout would be considered false as the cycle analysis becomes extremely negative for most of August, and part of September.

60min Chart