As volatility marches higher with VIX moving to 60, the runs in UVXY will expand in size going forward.
UVXY looks ready for a run...
Daily Chart
Thursday, August 22, 2019
Tuesday, August 6, 2019
$SPX - 2019 Model Update
SPX has continued to follow the 2019 Model with deep pullbacks and higher highs and higher lows.
This pullback in SPX should complete in August and is likely to be followed by a higher high in September according to the Model.
The price action is typical following a consolidation year.
Daily Chart
SPX 2019 Model:
This pullback in SPX should complete in August and is likely to be followed by a higher high in September according to the Model.
The price action is typical following a consolidation year.
Daily Chart
SPX 2019 Model:
Monday, July 29, 2019
VXO - 1987 Trendline
VXO has formed a trendline from 1987 to 2008. VXO has been spiking frequently, and has been in a rising trend for two years now.
When VXO trends up for two years, it typically sees a large move higher on the third year. An outsized move in volatility is coming due in the year 2020.
A test of the 1987 trendline would take VXO up to approximately 65, and surpass all peaks since 2008.
Yearly Chart
VIX typically tops out 5 points less then VXO at volatility peaks giving a VIX target of 60.
Yearly Chart
When VXO trends up for two years, it typically sees a large move higher on the third year. An outsized move in volatility is coming due in the year 2020.
A test of the 1987 trendline would take VXO up to approximately 65, and surpass all peaks since 2008.
Yearly Chart
VIX typically tops out 5 points less then VXO at volatility peaks giving a VIX target of 60.
Yearly Chart
Wednesday, July 3, 2019
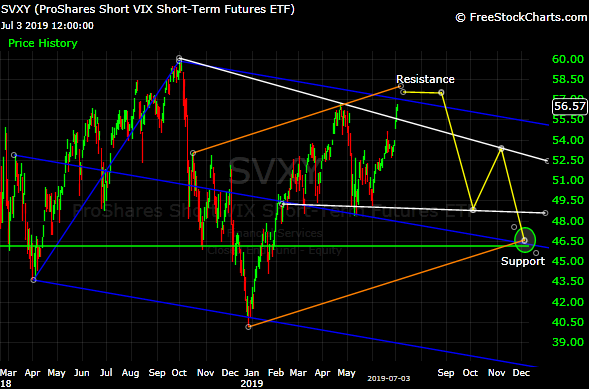
SVXY - Leading lower
SVXY has retested the April high yet it has no strength to test the September 2018 high.
It is clear that SVXY is leading lower. SVXY is close to the important blue line resistance, and sideways price action is likely to mark this high. Resistance is just above with a confluence of support showing at $46 later this year.
Daily
It is clear that SVXY is leading lower. SVXY is close to the important blue line resistance, and sideways price action is likely to mark this high. Resistance is just above with a confluence of support showing at $46 later this year.
Daily
Sunday, June 30, 2019
UVXY - Almost Ready - Low Due in July!
UVXY has been consolidating for another spike up, and a low is due in July.
The descending triangle broke down with a calculated UVXY target of $27. UVXY is almost ready with a low forming in the weeks ahead.
VIX is likely to retest it's December high by the September/October timeframe.
Daily
The descending triangle broke down with a calculated UVXY target of $27. UVXY is almost ready with a low forming in the weeks ahead.
VIX is likely to retest it's December high by the September/October timeframe.
Daily
Thursday, June 27, 2019
Bitcoin - Sudden Drop Next
Bitcoin analysis posted July 16th, 2018 proved to be accurate, with the bottom forming in December, and Bitcoin hitting the 14,000 target yesterday.
A sudden drop is coming next. Bitcoin is likely to drop to the 8,000 level which has become strong support.
Daily
Bitcoin: July 16, 2018 Analysis:
Daily
A sudden drop is coming next. Bitcoin is likely to drop to the 8,000 level which has become strong support.
Daily
Bitcoin: July 16, 2018 Analysis:
Daily
Wednesday, June 26, 2019
$VIX - Wedge - Short Term Targets
Interestingly VIX touched the nose of it's symmetrical triangle yesterday.
It appears that a wedge is forming. The trendline is just a touch lower. A period of high volatility is due to commence starting from July and into the Fall months.
Daily
It appears that a wedge is forming. The trendline is just a touch lower. A period of high volatility is due to commence starting from July and into the Fall months.
Daily
Subscribe to:
Posts (Atom)