SPX has turned lower off quarterly resistance. The chart shows a relatively expensive market. Thus a mild bear market is possibly beginning. If that is the case, then SPX may lose all gains since 2016 as shown with a measured decline.
SPX has had a great run, but may be ready to retrace some of the gains.
Quarterly
Monday, December 17, 2018
Monday, December 3, 2018
SPX - Measured Move Target
SPX has risen to test resistance as anticipated. Consolidation or minor dip at this level is to be expected.
The meltup is likely to continue soon. A measured move target is shown, with heavy resistance in red.
30min Chart
The meltup is likely to continue soon. A measured move target is shown, with heavy resistance in red.
30min Chart
Friday, November 30, 2018
SPX - Short Term Support/Resistance with 2,975 Target
SPX warmed up this week, and it is just the beginning. Minor resistance is overheard with support building at the 2,700 level.
30min Chart
Ultimately, SPX is moving towards a price target of 2,975. The channel is clearly defined with a shallow slope that is sustainable.
Daily
30min Chart
Ultimately, SPX is moving towards a price target of 2,975. The channel is clearly defined with a shallow slope that is sustainable.
Daily
Wednesday, November 21, 2018
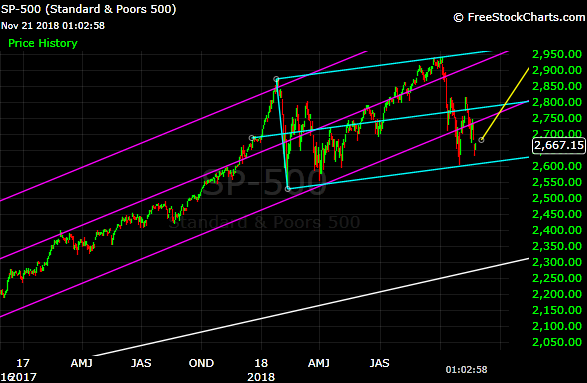
$SPX - Weekly signals Big Bounce Ahead
SPX was unable to maintain rising in the steep slope of the main pink channel. Another channel has formed, and the slope is gradual. Outlook for SPX remains positive as price will likely rise in the blue channel next.
The weekly chart of SPX is signalling a big bounce ahead.
Daily Chart
The weekly chart of SPX is signalling a big bounce ahead.
Daily Chart
Sunday, November 18, 2018
Bitcoin - Before/After
Bitcoin has declined off the white trendline identified in July. Price is approaching the target area.
A bounce is possible short term, but lower prices are likely ahead. Price action is consuming time, and the bottom may not form until next year.
Daily
July 16, 2018:
Daily
A bounce is possible short term, but lower prices are likely ahead. Price action is consuming time, and the bottom may not form until next year.
Daily
July 16, 2018:
Daily
Thursday, October 11, 2018
$SPX - Deep Pullback Confirmed
The deep pullback scenario played out and price is approaching the main support. The 2,750 deep pullback target was reached today. An underthrow is possible though.
Upside is becoming quite attractive to the magical 3,000 SPX target, and we would expect that in approximately 6 months.
The weak bull market continues with the main channel intact.
Daily Chart
Upside is becoming quite attractive to the magical 3,000 SPX target, and we would expect that in approximately 6 months.
The weak bull market continues with the main channel intact.
Daily Chart
Tuesday, October 9, 2018
$SPX - Head and Shoulders
SPX appears to be forming a nice example of a head and shoulders pattern. The Left shoulder and Head are complete with the Right shoulder next.
Price held the neckline firmly today.
60min Chart
Price held the neckline firmly today.
60min Chart
Subscribe to:
Posts (Atom)