Pages

Wednesday, February 29, 2012

$SPX - Ready to Decline

The pink midfork has been providing support to this rally.  The next midfork test will likely fail thus starting a decline.

The cycle analysis turns negative for SPX today.  This negative trend for the cycle continues into early March.  Finally, there should be sustained selling pressure.  The orange and blue trendlines are initial downside targets.

30min Chart

Sunday, February 26, 2012

Silver/Gold - Approaching Targets

After a consolidation period, Silver pushed higher last week.  Silver is currently testing the white trendline with significant resistance overhead.  It is anticipated that Silver can become much more volatile with choppy trading in coming weeks as it approaches the target above.  Overall there is anticipated to be some moderate upside for Silver into early March.

From this point onwards, during coming weeks, Gold is anticipated to have much better upside potential than Silver.  Generally, Silver could be more choppy with Gold holding gains and pressing higher more effectively.  

Of note, Gold and Silver moved higher last week with SPX hardly gaining anything for the week. 

60min Chart


The following chart is from January 27th Silver analysis.

Daily Chart


Update for Gold.  Gold is testing the midfork again. 

Daily Chart


The following chart is from February 8th Gold analysis:

Daily Chart

Saturday, February 25, 2012

TVIX - Premium and Extreme GAZ Bubble Example

As compared on the 5min chart, TVIX and UVXY were trading in synchronized fashion until the close of trading on February 21st.  After the close on that day, Credit Suisse announced a suspension of further TVIX issuances:

http://finance.yahoo.com/news/Credit-Suisse-Temporarily-prnews-3084612990.html?x=0

This resulted in TVIX trading at a premium starting on February 22nd.  In another recent example, GAZ, a Natural Gas futures ETN traded at an extreme premium.

"Premiums occur when a fund is no longer able to create the shares needed to satisfy demand, ultimately capping the fund's growth. In essence, GAZ has begun to trade like a closed-end fund."

http://finance.yahoo.com/news/Look-Out-Nat-Gas-ETN-Premium-tsmf-1275319962.html?x=0

An extreme bubble formed in GAZ.  TVIX is a much larger ETN than GAZ.  There are some similarities in that both GAZ and TVIX issuances were suspended after a long downtrend on the Daily charts. 

It is unclear what will happen to the current premium in TVIX going forward.  Ultimately, as long as issuances are suspended, it depends on the balance of supply and demand characteristics which are influenced by various factors including market conditions, behaviour of the VIX and VIX futures etc...  Another consideration is whether an accumulation of short interest in GAZ resulted in a subsequent short squeeze.

In any case, an understanding of the facts, and a prudent approach is required considering the uncertainties involved going forward. 

5min Chart


An extreme example of an imbalance can be seen in the recent GAZ bubble.

Daily Chart

Tuesday, February 21, 2012

$SPX - This Rally is Not a New Bull

It has certainly been a strong rally, but it is not a new bull run.  The reasons are clear.  The Nasdaq 100 has been underperforming SPX since the October bottom.  NDX is a leading index, and the underperformance is an important confirmation that this rally should not be trusted.   

A major SPX decline is necessary to reconfigure these daily charts so that the NDX and DAX are actually outperforming.  The tape tells the tale. 

The 15min chart shows the weakening performance of a number of leaders since February 3rd, and the comparison suggests the rally is nearly complete.

Daily Chart


The DAX is still underperforming since summer 2011.  In the summer of 2010, the DAX was leading up. 

Daily Chart


Since February 3rd, the Dow Transports have struggled with lower highs.  The Russell 2000, and the Financials have been weakening relative to SPX.

15min Chart

Monday, February 20, 2012

AAPL - Parabola Update - Correcting but Not Topped

The behaviour of Apple is one of the most important considerations in the current market.

Last week there was quite a significant surge up and reversal in Apple.  The stock fell $40 off the high.  However, the parabolic top is not yet complete.  Mathematically these tops are predictable, and tend to finish stronger than what we saw last week with a spectacular phase and vertical finish. 

Apple is correcting now, and is anticipated to decline further to test the red fork next at $480 or a little lower.  The final parabolic top is targeted at $578 in early March.

Daily Chart


Apple closed red on Friday, and is already leading down, and this is a reason to be bearish for the coming week.  SPX has been hovering at the midfork.  As Apple corrects, SPX is due to at least test the orange trend line at 1324-1328 around February 27th.

Daily Chart

Saturday, February 18, 2012

TVIX - Triangle Target $23.35

TVIX traded in the orange fork last week as shown on the lower 30min chart.  The upper orange fork stopped the advance, and the orange midfork was tested Friday.  Support held on Friday, and the price could trade in the green oval Tues/Wed.  The 23rd may be the most probable date for a major breakout above the upper white triangle line.

The target is approximately $23.35 on Feb 27th.

15min Chart

30min Chart

Wednesday, February 15, 2012

TVIX - Larger Moves Coming

Volatility in the markets is expected to increase this month according to my previous S&P 500 analysis.  The geometry for TVIX favors a series of large whipsaws in coming weeks.  The first target is approximately $23.50.  The inverse, XIV, then becomes interesting for periods of time. 

$24.75 is the maximum target identified for the month of February.

30min Chart

Monday, February 13, 2012

$SPX - Volatility to Increase

The following charts incorporate many important dates and events that have been developing in the markets recently.  Putting it all together has been fairly complex:

1.  Silver and Gold should dip for a few days, but then have substantial upside in coming weeks.  My large scale Silver pattern and Price/Time box pattern remain bullish.

2.  Apple should slump for a few days, but a parabolic move appears well underway, and there is nothing stopping it from completing a vertical parabolic move higher in the near term. 

3.  VIX has been increasing with volatility expected.

4.  The "Eye of the Hurricane" chart indicates Feb 27-28th as an important date.  It appears to be a low.

5.  The overall picture is extremely bearish.  

All of the events and timing can be explained with the following charts.  In addition, the symmetry and geometry are lined up as well.  Markets are ready to decline into the middle of this week.  However, with Apple going parabolic, SPX will still likely push slightly higher into next week before collapsing.  This configuration of geometry indicates upside to approximately 1363 SPX.

30min Chart


The market has been grinding up for a while, yet the overall picture is really bearish.

Daily Chart

Sunday, February 12, 2012

AAPL - Parabolas Never End Well - Apple CRASH Setup

Apple is going parabolic on a daily time frame.  $544 is an upside target this week as it goes vertical.  We saw an example of the VIX making a parabolic intraday move on Friday, and it collapsed into the close as predicted. 

Parabolas do not "end well" mathmatically. 

Watch Apple this week.  Once the parabola exhausts, a collapse could take it down to a downside $390 target quickly.

Apple CRASH starts this week!   

Daily Chart

Saturday, February 11, 2012

TVIX - Timing Cycles and Price Target Geometry

VIX went parabolic on Friday as expected in the analysis from last Saturday, Feb 4th.  Therefore, TVIX went parabolic, and it was mentioned Friday that parabola's do not "end well" with price anticipated to fall. 

Price fell into the close as expected.  Monday, price should settle back to at least the 38.2% retracement near $18.30. 

The price geometry specifies a surge up next week to a minimum target of $23.50.  Inverse VIX futures products such as XIV are available as well.  

15min Chart


The following is the chart posted last weekend on Saturday, Feb 4th:

"A bullish wedge pattern appears complete for TVIX as of Friday, with a minimum of $21 to maximum of $23 targeted for next week."

The analysis proved accurate with the bottom date called by the timing cycle, and the minimum $21 target for TVIX hit on the date specified.

30min Chart

Wednesday, February 8, 2012

Gold - Parabolic Move Coming

Gold and Silver are due to dip somewhat short term.  The overall picture remains extremely bullish for Gold especially.  In approximately 4 weeks, Gold should surge up in a parabolic rise to a target at $2,050. 

Daily Chart


Silver has been trading flat but finally should be ready to dip, and then rally up strongly.  In approximately 4 weeks, Silver futures should reach $38 according to the geometry and timing/price box pattern.

Only the next couple of moves are shown on the chart.  Updates will be coming at a later date.

60min Chart

Tuesday, February 7, 2012

$SPX - Eye of the Hurricane - Updated

During the Aug-Oct period in 2011 the turquoise fibonacci arc timing resulted in turns in the market.  Feb 8th is an important turn date in the timing model.  A decline to test the orange neckline is anticipated next.

Another date to watch later in February is around the 27th or 28th.  That may be a lower high to test the red fibonacci arc with the bottom to fall out soon afterwards. 

Daily Chart

Saturday, February 4, 2012

$SPX - CRASH #1 of 2012 Underway

Friday's rally pushed the geometry of time and price into perfect alignment.  As a result, the Symmetry Line is confirmed, and the rally since October is over.

Next week, a decline to the 1289 to 1295 area is indicated by the symmetry.  After that, a sharp bounce (lower high) is anticipated to test the upper red fork line at point 4 later in February.  Point 4 to point 5 in the symmetry is the Crash #1 of 2012.


Calculated Target:

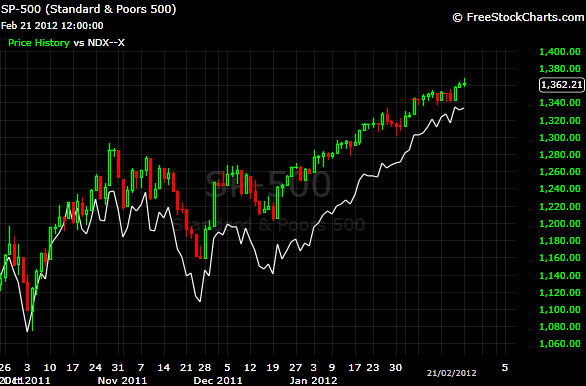
The May 2011 high was 1370, and SPX fell to the Oct low at 1074.  That is a 296 point drop.  The Friday, Feb 3rd high at 1345 SPX minus 296 points equals 1049 SPX.

Therefore, the calculated target for Crash #1 of 2012 is 1049 SPX.


Timing:

Compared to the 2-week late July/Aug Crash in summer of 2011, my work indicates that Crash #1 of 2012 is comparatively larger in price, but with half the velocity in time as summer 2011. 

Crash #1 of 2012 is expected to take 4 weeks to plunge from late February to a bottom at the 1049 target in the last week of March. 
Daily Chart


A bullish wedge pattern appears complete for TVIX as of Friday, with a minimum of $21 to maximum of $23 targeted for next week. 

The TVIX target is expected with SPX declining from point 2 to point 3.

30min Chart

Thursday, February 2, 2012

$SPX - Update

The index looks nearly exhausted.  A final pop to the target level may be in order.  Yet, the big picture remains bearish.

The symmetry tells the story, and those charts will be coming shortly.

Daily Chart


The picture with NDX remains the same.  The weakness from the Oct 2011 low is clearly evident. 

2hour Chart