Pages

Tuesday, March 29, 2016

$SPX/VIX - Important Trendlines - 5th Wave

SPX made a dip off the white "trajectory" resistance.  It now appears to be making the 5th wave push.  The red trendline is just above in the case that it attempts to overshoot the white resistance. 

It is a similar situation as the runup in October 2015, and another failure would likely result in a significant April plunge.

It is reminiscent of 2008 - though not as severe a downtrend this time around.  In 2008, the market plunged May into November - note also an election year!

Daily


VIX is nearing the long term trendline from July 2014.

Daily


Saturday, March 19, 2016

XIV/UVXY Targets - Cycle Update

It is probable that XIV is completing the blue arrow high as shown in the model.  Eventually XIV should test the lower white line, and so there is potential for a large decline ahead.

UVXY has a first target of $35 initially.  The second target suggested by the model is a minimum of $80, with potential for up to $120 as a maximum target.

The next turn date for the SPX timing Cycle is April 8th.  SPX should see a significant initial plunge by or around that date to 1930 to 1950.

2hour Chart


Hang Seng 1997 Crash Model:


UVXY short term target.  The first target is shown of a much larger move up!

2hour Chart


Monday, March 7, 2016

$SPX - Weekly - Rounded Trajectory!

The Weekly chart for SPX has formed a well defined Rounded Trajectory.  Whereas SPX found support at the red 200 weekly moving average earlier this year, SPX is now approaching resistance from the blue 50 weekly moving average which is also declining sharply and thus pressuring to the downside.

It seems unlikely that SPX will be able to muster the velocity needed to break free from the gravitational pull that has been pulling it downwards.

The most probable trajectory is as shown.  While there is minor upside potential short term, a test of the red 200 weekly moving average is quite likely in the months ahead.  

Weekly Chart


Thursday, March 3, 2016

XIV - Broadening Formation Identified

A broadening formation has been identified for XIV.  Price is nearing the upper boundary of the pattern. 

March looks interesting to watch for a potential reversal.  A reversal could be quite negative, and eventually the lower white line is a target.

60min Chart


Broadening Formation:


Tuesday, March 1, 2016

$SPX - Target Reached - Important Inflection Point - Next Targets!

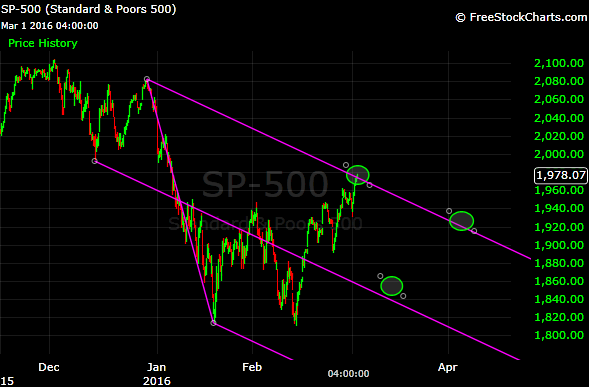
SPX has reached the minimum target of 1975, and closed at fork resistance.  Although it is possible that SPX overshoots, this is an important inflection point.

The turn date for SPX was due February 26th, and so there is little time left for SPX to form a high.  The next turn date is March 14th. 

Oil and SPX remain highly correlated which raises the probability for Oil to capitulate, and bottom out in the next several months ahead.

60min Chart


UVXY declined as expected from midfork resistance and is near lower fork support.  UVXY has formed a clearly rising trend, and may have several months of substantial upside ahead according to the model.

60min Chart


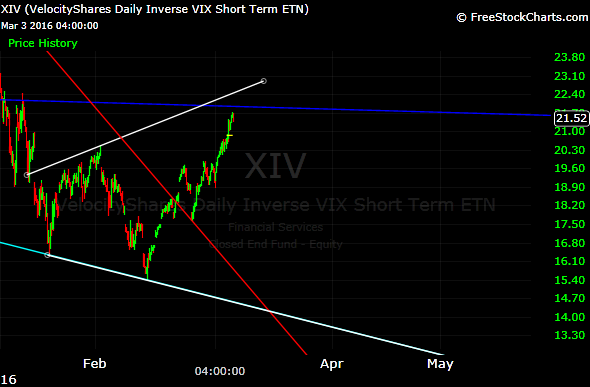
The behaviour of XIV continues to be consistent with the Hang Seng Crash of 1997.  XIV may have several months of significant downside ahead according to the model.

2 hour Chart


1997 Hang Seng Crash Model: