Pages

Saturday, March 30, 2013

$SPX - Deja Vu Cycle Detailed Peak

SPX is thought to be approaching the Cycle peak at point A.  The V-dip in late February and the choppy period during March were price behaviour specified by the detailed Cycle.  These details are shown on the Deja Vu Cycle below.

Once point A is reached, the Cycle predicts a plunge to the red trendline at point P.

VIX has already tested a very important trendline as well.

2hour Chart
 
Deja Vu Cycle Peak in close detail.  Notice the overshoot at point A!


VIX has already tested the orange trendline going back to 2008. 

3day Chart


Monday, March 18, 2013

$SPX - Slide to Red Trendline Phase Underway

The Cycle estimate for the rally to peak was March 20th (marked by the white line), but it likely already peaked on Friday a little early.  The timing estimate was an approximation that is close enough since the Deja Vu Cycle is large in scale. 

SPX may attempt to rally back somewhat short term, but damage is done, and the slide down to the red trendline phase is most likely already underway.  The slide should be a slope of hope with brief bounces as it declines down to test the red trendline.

A timing estimate for this phase of decline to complete will be coming shortly. 

Daily Chart


The Deja Vu Cycle predicts a decline to Point P as the next major move in the Cycle.  The Cycle shows a choppy slide (slope of hope) with brief bounces as it declines down to Point P.


Sunday, March 10, 2013

$VIX - Backtesting White Trendlines

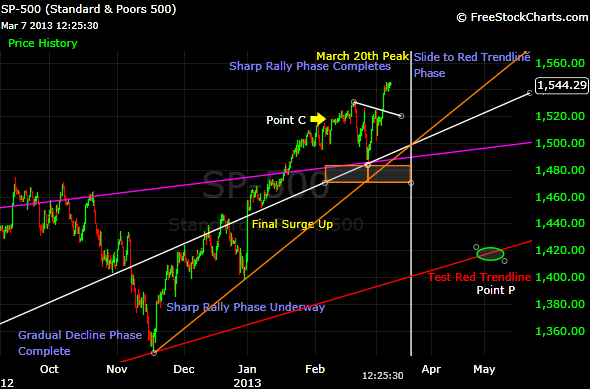
What is most interesting about the VIX is that when SPX declined substantially from September into the November low, VIX did not spike.  Since then the VIX has spiked twice on relatively small dips for SPX in December and also February.  VIX was a great indicator in November to correctly signal a rally coming for SPX in months ahead. 

Similarly, the recent spikes in VIX signal serious warnings for the future.  The conclusion is that the SPX rally is in the very late stages.  

VIX is backtesting the white trendlines and therefore may see a small pop this week.  VIX could still see lower after a small pop as the SPX rally finishes.  However, it is important to emphasize the loud and clear warning signals from the VIX going forward.

Daily Chart


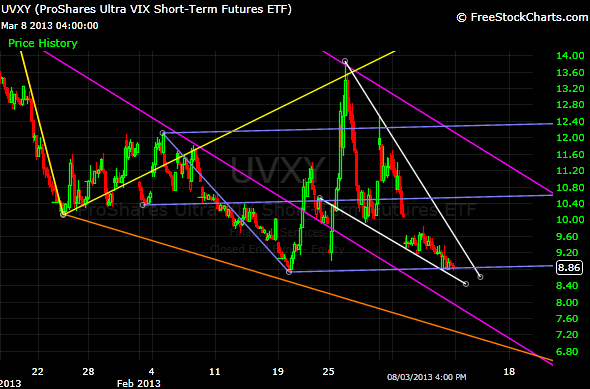
The pink fork lines were excellent in defining that last spike for UVXY.  UVXY has formed a wedge (white) and may see a small pop this week.  After that it may cool off again and see the final low. 

60min Chart

Thursday, March 7, 2013

$SPX - Cycle Peak Timing Estimate

SPX is due to peak approximately March 20th according to the Deja Vu Cycle measurement.  The last "V" dip was predicted almost exactly to the day, and price level. 

A small dip to the white trendline looks likely as the next short term move with a final peak approximately March 20th. 

The Cycle suggests little upside and the next major phase is to slide down to Point P with a test of the red trendline for SPX.  VIX currently has a higher low than the double bottom formed in January and February, and provides strong evidence in support of the Cycle.

2hour Chart
 
The Deja Vu Cycle predicts a peak with a decline to Point P as the next major move in the Cycle. 


Sunday, March 3, 2013

$SPX - Deja Vu Large Cycle Update

As projected on February 18th, the "V" dip occurred as predicted by the Deja Vu Cycle.  The "V" dip can be seen clearly on the Deja Vu Cycle just after point C on the lowest chart. 

The pink line geometry marked the bottom of that "V" dip. 

Most importantly this "V" dip shows exactly where the market is currently in terms of the large Cycle.

Daily Chart


Notice that the "V" dip can be seen clearly on the Deja Vu Cycle just after point C.