Pages

Monday, January 31, 2011

Expanding Triangle Ending Diagonal Top

Very bearish topping pattern for Financials - same pattern in the case of $Rifin.  I have drawn in approximately what I am looking for next.

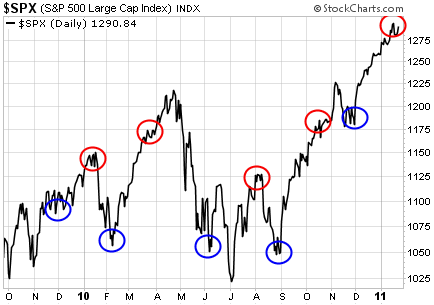
There are currently too many comparing the runup and top in April 2010 to the January 2011 top.  The market has a way of alternating when too many are expecting the same result.  Therefore, notice how I have drawn out a selloff for Financials with a spike next, and then the collapse to follow.  My analysis shows that several other methods are indicating the same result. 

This contrasts greatly with the April 2010 top and May 2010 flashcrash scenario.          
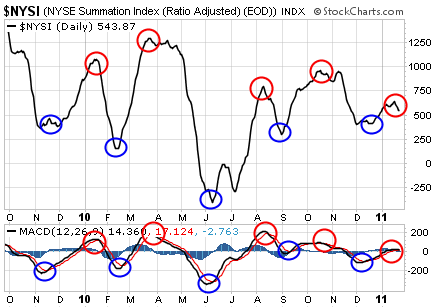
Daily Chart

Sunday, January 30, 2011

$Rifin Head and Shoulders/Double Top

Short term levels to watch for $rifin include 840 which is the Dec 13th, 2010 high (840 is also the 38.2% Fibonacci retracement off the recent January highs). 

The next level is $rifin 834 which is the Nov 5, 2010 top, and also the approximate measured target from a breakdown of the H&S pattern.

Notice that on Friday Jan 28, 2011 the neckline was broken as of the close.

30min Chart 

Tuesday, January 25, 2011

Summation Index

The NYSE Summation Index has rolled over.  Look at the higher low that $NYSI made in early July 2010 versus June 2010 in contrast to $SPX with a lower low.  Notice how the current top in $NYSI indicates weakness with a lower high from the previous peak in October (and lower high from all major peaks over the last year).  Again, this contrasts with $SPX.

It has even formed a bearish Head and Shoulders pattern since July 2010.     


The signal performed very well over the last year: