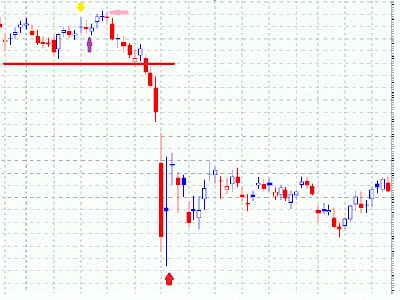
As predicted by the Cycle, VIX has been forming a low around the pink fork line.
VIX bottomed mid-March
and has been making higher lows since that time. In the Cycle, the red arrow
low is anticipated to be another higher low for VIX. VIX has been
flirting with longer term trend lines of resistance going back to
2008.
From this red arrow low, a steady rise for VIX into the end of year is shown by the Cycle. The next high for VIX is due after a several months rise.
60min Chart
Before:
Analysis posted October 13th.
"VIX is likely approaching the red arrow low in the Cycle. The red arrow low should form late this month possibly in the 13's."
60 min Chart
VIX Cycle 1:
Wednesday, November 6, 2013
Sunday, October 13, 2013
$VIX - Cycle 1 Approaching Red Arrow
VIX is likely approaching the red arrow low in the Cycle. The red arrow low should form late this month possibly in the 13's.
VIX bottomed mid-March and has been making higher lows since that time. In the Cycle, the red arrow low is anticipated to be another higher low for VIX.
VIX has been flirting with longer term trend lines of resistance going back to 2008.
60min Chart
VIX Cycle 1:
VIX bottomed mid-March and has been making higher lows since that time. In the Cycle, the red arrow low is anticipated to be another higher low for VIX.
VIX has been flirting with longer term trend lines of resistance going back to 2008.
60min Chart
VIX Cycle 1:
Wednesday, September 11, 2013
$SPX - Cycle Update
The Cycle for SPX showed the retracement from the yellow arrow. Even though SPX is bouncing sharply at the moment, it is not clear that the purple arrow Cycle low is in place yet. Recent lows could potentially be retested.
SPX may find resistance around the pink resistance line once again.
60min Chart
Crash Cycle #1:
SPX may find resistance around the pink resistance line once again.
60min Chart
Crash Cycle #1:
Sunday, September 8, 2013
UVXY - Mount Everest Cycle First Blue Arrow
Over the summer months, UVXY dropped down and formed the first blue arrow low in the Mount Everest Cycle. UVXY should retest around that low according to the Cycle as it approaches the second blue arrow.
Since it is a large scale Cycle, it can take time (weeks) to reach the second blue arrow.
The VIX Cycle is helpful for short term timing. The VIX Cycle orange arrow high was likely August 30th.
4hour Chart
Large Scale Mount Everest Cycle:
Since it is a large scale Cycle, it can take time (weeks) to reach the second blue arrow.
The VIX Cycle is helpful for short term timing. The VIX Cycle orange arrow high was likely August 30th.
4hour Chart
Large Scale Mount Everest Cycle:
Monday, August 26, 2013
Silver - Before/After Cycle Update
Silver continues to follow the large scale Cycle with the rise from the turquoise Cycle low.
June:
"Silver is likely bottoming out at the turquoise arrow Cycle low. The rally next for Silver and Gold should be very sharp according to the Cycle. Price goes almost straight up from the turquoise arrow low in the Cycle."
2day Chart
Before:
2day Chart
Silver Bear Market Cycle:
June:
"Silver is likely bottoming out at the turquoise arrow Cycle low. The rally next for Silver and Gold should be very sharp according to the Cycle. Price goes almost straight up from the turquoise arrow low in the Cycle."
2day Chart
Before:
2day Chart
Silver Bear Market Cycle:
Sunday, August 18, 2013
$VIX - Cycle 1 Orange Arrow
VIX is likely near the orange arrow in the Cycle. Therefore, VIX should settle and cool in the short term. In the VIX Cycle 1, the time from the green to orange arrow is approximately equal to the time from the orange to the red arrow.
At the current pace timing can be estimated. The red arrow is due to be reached in September as shown on the chart. Once the red arrow is reached, then the VIX Cycle is mature.
30min Chart
VIX Cycle 1:
At the current pace timing can be estimated. The red arrow is due to be reached in September as shown on the chart. Once the red arrow is reached, then the VIX Cycle is mature.
30min Chart
VIX Cycle 1:
Thursday, August 15, 2013
$SPX - Retracement Update
SPX found resistance around the pink line and retraced from that level. The Cycle showed the retracement from the yellow arrow.
30min Chart
Crash Cycle #1:
30min Chart
Subscribe to:
Posts (Atom)


