XLE will not be able to hold back much longer. Markets have dropped but Oil continues to strengthen. All efforts to contain inflation have now failed. Daily
Everyone is waiting on Powell---cash is king to he speaks --this can either way--just sitting at the 200 day Moving average
Remember----using Elliot wave theory--this is wave A down ( 1/12 to 1/24)--600 points--wave B up into Thursday maybe SPX 4500--and then wave C down--it will take 8 days or more and be greater then Wave A down (more then 600 points down ---could be 900 points)
The Fed made their point---they need to control inflation--their is only two ways: raise rates or crash the market!
guys--the Monthly candlestick comes into play on Monday--it could be a reversal for the Month of February--so far we are closing 5 days below the 200 day Moving average --SPX 4438 to 4400--we need to rally in the next two days --or we can sell off into March!----I hope we rally
By the model the correction in NDX is over. Yes it could retest Monday's low possibly. It has been as expected this week according to the model. I had said it would struggle This week as it finds its footing. This is setting for a strong February.
"This week the NDX will likely struggle into month end. In this model the next bar is actually red. For this week stabilize and build support then February melt up."
I think the correction in nasdaq100 is not over. I see waves 1234 and wave 5 will go down around 13000, maybe next week. And after yes, rebound to 15000-16000
There is a wall at SPX 4400 And 4600---The Monthly chart pointing down--that is Normally followed another month of Down--just be safe--take it slow--Judge it day by day!
I'm long always now. KODK is very oversold and due for a technical bounce at least. Ocugen I have a big plan in mind, very impressed. I have a major update coming for OCGN.
Monday --Good chance was Window dressing ---as I said --I would like to see new highs --I know --we have to test the lows again -sometime in the next 5 to 10 trading days--Double bottom---50 percent retracement level hit Monday --still not enough buying yet --only --20% of buyers--could be Window dressing---be careful!
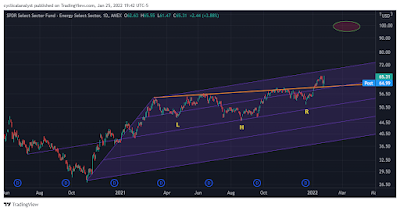
Over the course of 2021, XLE consolidated forming an inverse Head and Shoulders pattern. XLE has started to breakout!
ReplyDeleteToday's candle on XLE was bigger than anything going back over a year
ReplyDeleteSPX according to plan. Starting to solidify this week as we get ready for the February rally.
ReplyDeleteNDX can get a strong push up into Friday towards the 200 day average at 15,000.
DeleteXLE making fresh highs...
ReplyDeletesc,
ReplyDeleteEveryone is waiting on Powell---cash is king to he speaks --this can either way--just sitting at the 200 day Moving average
Remember----using Elliot wave theory--this is wave A down ( 1/12 to 1/24)--600 points--wave B up into Thursday maybe SPX 4500--and then wave C down--it will take 8 days or more and be greater then Wave A down (more then 600 points down ---could be 900 points)
The Fed made their point---they need to control inflation--their is only two ways: raise rates or crash the market!
It seems they've decided to do nothing about inflation.
DeleteLet prices readjust higher then go from there.
Firstly the FED tried to jawbone prices lower saying inflation was transitory. Oil went up.
ReplyDeleteSecondly Biden sold Oil reserves. Oil dipped and has risen, regaining everything.
Thirdly markets corrected this month. Oil made intraday dip and spiked up.
good analysis--waiting on Powell
ReplyDeleteBank of Canada hold rates unchanged. Forecast 5% inflation to end of second quarter, then lowering to 3% in second half of year.
ReplyDeleteThanks Dennis!
DeleteSC.. is the AMC trade a scratch now?
ReplyDeleteI'm going to wait into February
DeleteWait for Powell----it matters how many times --he is looking to raise the rates this year?
ReplyDeleteamc----nice move!
ReplyDeletesc,
ReplyDeletewe need to close above the 200day moving average --4400
sc,
ReplyDeletejust keep this in the back of your mind---there was a rogue option –executed on SPY 364.48—yesterday ---just the 30 min chart—just weird!
if we don't double bottom---we have support at that level!
SC - VIX now has 7 straight closes outside its Bollinger band...big SPX rally to finish the week or do we need to wait until next week?
ReplyDeleteThis week struggle. Next week I don't have high expectations but it will solidify. Then rally hard the remainder of February.
DeleteI hope ---I am wrong ---We need to bounce!
ReplyDeleteinteresting chart of the nasdaq since the 70s
ReplyDeletehttps://www.labolsadepsico.com/nasdaq-hasta-donde/
Thank you Charles, excellent! Things are starting to get interesting...
Deleteguys--the Monthly candlestick comes into play on Monday--it could be a reversal for the Month of February--so far we are closing 5 days below the 200 day Moving average --SPX 4438 to 4400--we need to rally in the next two days --or we can sell off into March!----I hope we rally
ReplyDeletesc,
ReplyDeletewe are back above 19 on UVXY---normally a spike to 22 to 26 when this happens---any advice????
$NYMO heading lower, crash wave like March 2020 or retest Monday's low. Risk on has changed to risk off.
DeleteBy the model the correction in NDX is over. Yes it could retest Monday's low possibly. It has been as expected this week according to the model. I had said it would struggle This week as it finds its footing. This is setting for a strong February.
ReplyDeleteSCJanuary 22, 2022 at 10:43 AM
Delete"This week the NDX will likely struggle into month end. In this model the next bar is actually red. For this week stabilize and build support then February melt up."
FED decides to wait until March to look at rates. Meanwhile Crude rising at a pace of $15/barrel per month.
ReplyDeleteI think the correction in nasdaq100 is not over. I see waves 1234 and wave 5 will go down around 13000, maybe next week.
ReplyDeleteAnd after yes, rebound to 15000-16000
first wave 4 to 14700 next week and then 13000
Deletesc,
ReplyDeleteThere is a wall at SPX 4400 And 4600---The Monthly chart pointing down--that is Normally followed another month of Down--just be safe--take it slow--Judge it day by day!
Good confirmation of the model. Markets look to have solidified, formed that foundation this week for the February rally.
ReplyDeletevery true!
ReplyDeletekodak?
ReplyDeleteOcgn?
Just waiting?
I'm long always now. KODK is very oversold and due for a technical bounce at least. Ocugen I have a big plan in mind, very impressed. I have a major update coming for OCGN.
DeleteFreedom Convoy has landed in Canada!!!
ReplyDelete🤩
DeleteOil gapping higher. Chevron earnings came in light on Friday. ExxonMobil reports Tuesday and Shell Thursday. A busy week for Oil companies reporting.
ReplyDeletesc,
ReplyDeleteSPX is climbing----needs to get above--4600 to be bullish again!
Another good day and further confirmation of the model.
ReplyDeleteUVXY dip to $11, bounce to $16
ReplyDeleteWe can trade UVXY next, now that we have a good rhythm going
ReplyDeletesc,
ReplyDeleteUnderstood--we will retest 1/24 low --double bottom---probably in the next two weeks--lets see how high we go?
Sounds good! Thanks for the update.
ReplyDeleteSc any updates on amc or ocgn ?
ReplyDeleteOCGN is slowly warming up and for February can recover all of January. February $4.50.
DeleteThere has been an important development recently for OCGN and I have a model for this stock, with let's just say very impressive targets later...
sc,
ReplyDeleteMonday --Good chance was Window dressing ---as I said --I would like to see new highs --I know --we have to test the lows again -sometime in the next 5 to 10 trading days--Double bottom---50 percent retracement level hit Monday --still not enough buying yet --only --20% of buyers--could be Window dressing---be careful!
New chart posted!
ReplyDelete