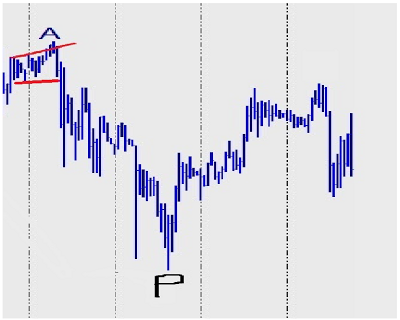
Time and price has reached an interesting turning point. Today, July 28th is the date forecast for a turn date and high. August 10th is a date for a significant low.
UVXY appears to be ready for a pop.
15min Chart
Thursday, July 28, 2016
Wednesday, July 20, 2016
XIV - Approaching Critical Time and Price
XIV is approaching the large June gap. Time and price is near an interesting turning point in the week ahead.
July 28th is a date for a high. August 10th is a date for a significant low.
60min Chart
July 28th is a date for a high. August 10th is a date for a significant low.
60min Chart
Thursday, July 14, 2016
$SPX - Deja Vu Cycle Model
SPX spiked up, and appears to be forming an ascending broadening wedge according to the Cycle model. Currently SPX is likely forming a high.
Support is located at the lower red line. Therefore, SPX should work it's way down to test the lower red support line with time.
Daily Chart
SPX Deja Vu Cycle:
Support is located at the lower red line. Therefore, SPX should work it's way down to test the lower red support line with time.
Daily Chart
SPX Deja Vu Cycle:
Monday, July 11, 2016
$SPX - Outlook - Levels and Timing to Watch
SPX continues to struggle and test the level of long term resistance. A pullback is due this week. However, the level of 2,100 may offer support during July.
July 31st is an important time for a potential high. August 10th is a date to watch for a potential low.
60min Chart
July 31st is an important time for a potential high. August 10th is a date to watch for a potential low.
60min Chart
Subscribe to:
Comments (Atom)


