SPX warmed up this week, and it is just the beginning. Minor resistance is overheard with support building at the 2,700 level.
30min Chart
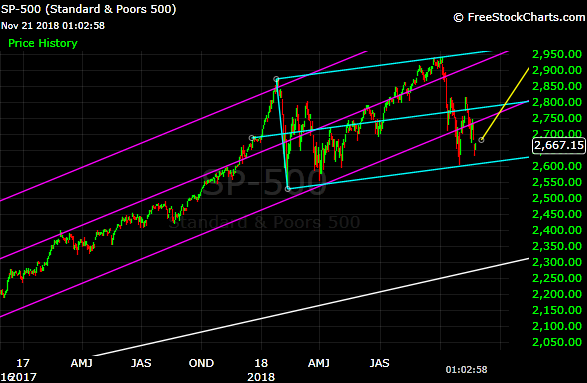
Ultimately, SPX is moving towards a price target of 2,975. The channel is clearly defined with a shallow slope that is sustainable.
Daily


